Your side effects, set against each dose.
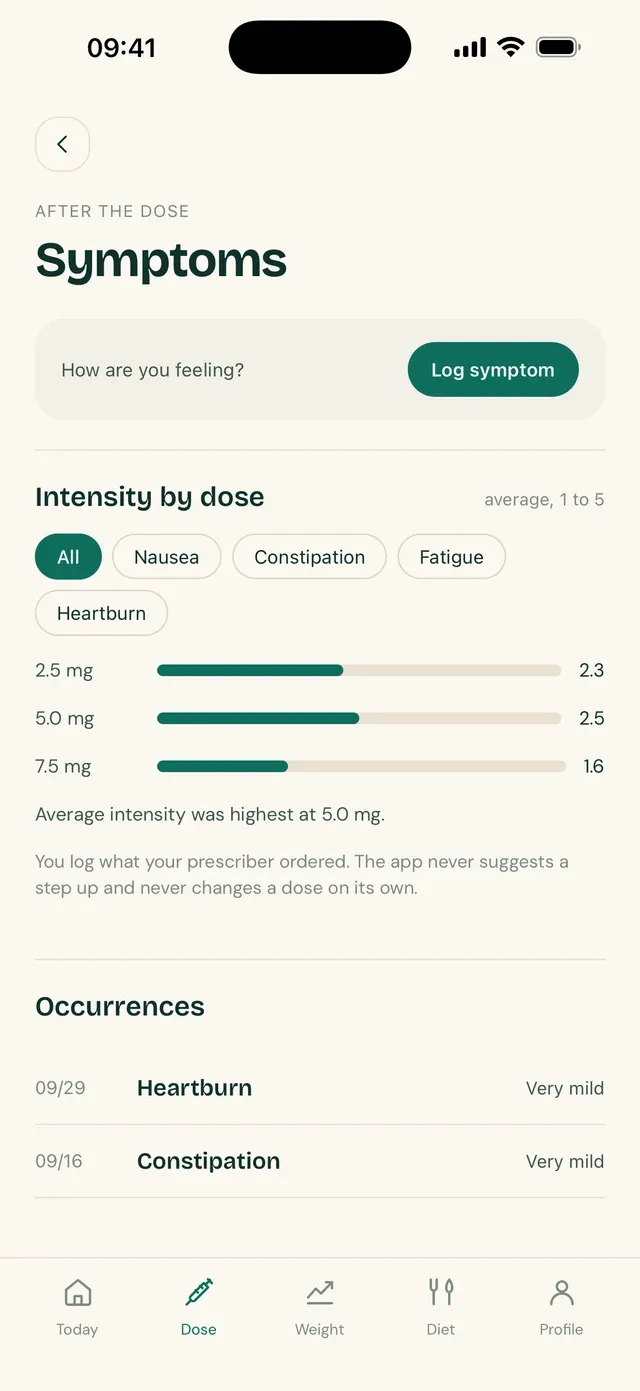
In TirzeFlow you can log the side effects of your treatment on the day they happen, with the type and the intensity on a five-level scale. The app keeps the history and shows the average intensity on each dose you have used, which is the question that tends to come up at the appointment.


Five levels, with the order inside the word.
The scale runs from Very mild to Very severe, through Mild, Moderate and Severe. Each level comes with a description of how much the symptom got in the way of your day, so the number stored means the same thing today and two months from now.
The scale was adapted from the PRO-CTCAE, the patient-reported version of the criteria from the United States National Cancer Institute. The descriptions talk about what happened, not about what to do.
An entry belongs to a day. You pick the type, the intensity and, if you like, write a short note. The history lists your symptoms by date, with the type and the intensity of each one.
Intensity on each dose.
The Side effects screen has a section that shows, for each dose you have used, the average intensity of the symptoms logged while you were on it. You can narrow it down by type of symptom.
The calculation is conservative. A symptom counts toward the last dose injected up to seven days before it, and a dose with fewer than three entries appears without an average rather than showing a number drawn from almost nothing.
When the gap between the highest and the lowest average is small, the app says the intensity was similar across doses instead of highlighting a variation your entries do not support. The section updates as soon as you save a new symptom.
The app shows, and does not advise.
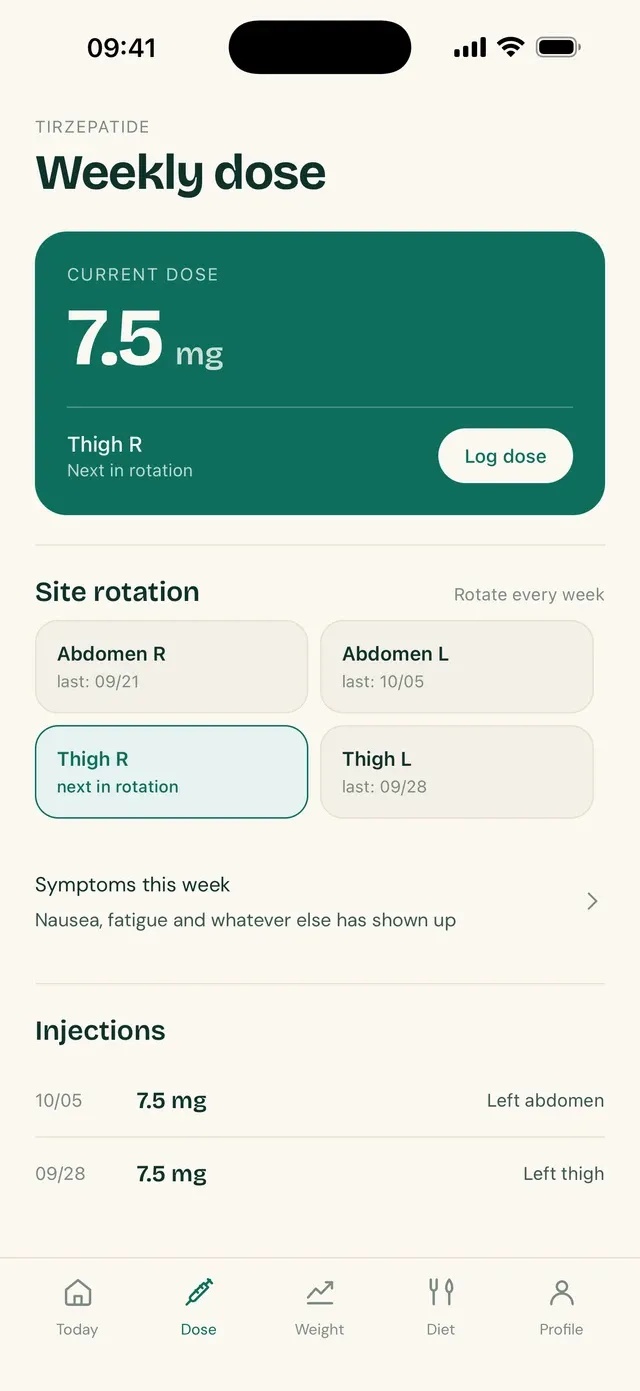
TirzeFlow does not name the cause of a symptom, does not attribute it to the medication and does not recommend what to do about it. The intensity by dose section describes your entries; interpreting them is up to the professional who follows you, the one who prescribes your treatment.
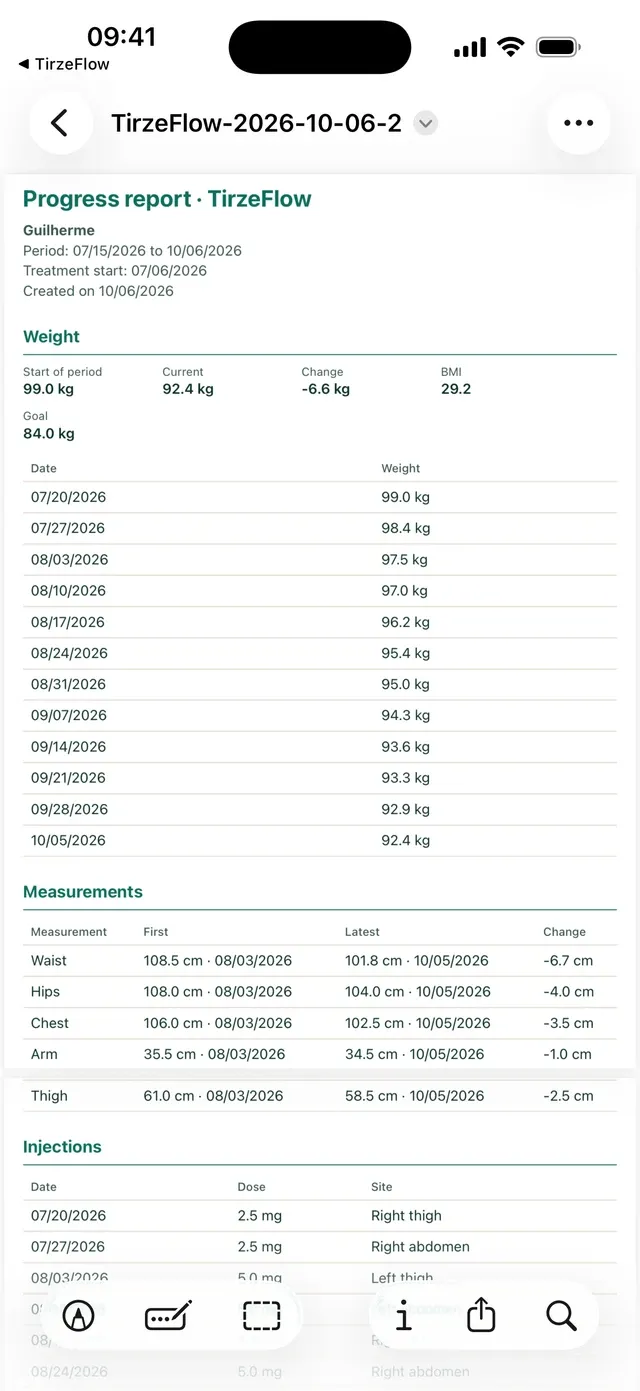
Side effects go into the PDF report, with date, type and intensity, and the average per dose goes with them. An entry made by mistake can be deleted from the history.
Frequently asked questions
Which symptoms can I log?
Ten types: nausea, constipation, diarrhea, vomiting, fatigue, headache, heartburn, loss of appetite, injection site reaction and other. Each entry keeps the type, the intensity, the day and an optional note.
How does the intensity scale work?
There are five levels: Very mild, Mild, Moderate, Severe and Very severe. Each one comes with a description of how much the symptom interfered with your activities that day.
Does the app say whether a symptom is caused by the medication?
No. TirzeFlow shows your entries organized by dose, but it does not assign a cause to any symptom. That assessment belongs to your doctor.
Why does a dose show no average?
Because there are fewer than three symptom entries on that dose. With so little data, an average would say more than the entries allow, and the app prefers not to show one.
Do side effects appear in the appointment report?
Yes. The PDF carries the side effects from the period you chose, with date, type and intensity, plus the average intensity on each dose.
Sources
- National Cancer Institute. Patient-Reported Outcomes version of the Common Terminology Criteria for Adverse Events (PRO-CTCAE). https://healthcaredelivery.cancer.gov/pro-ctcae/
See also
Updated on
Start your diary today.
Free, with no ads, in English, Portuguese and Spanish.